Methods
Overview
A simplified scheme of zDB annotation workflow is shown in Figure 1. In summary:
Input consists of annotated genome assemblies. These could be downloaded from GenBank or collected and assembled by the user.
Protein sequences are annotated based on data from multiple source databases and annotation softwares.
- Protein sequences are clustered into orthologous groups (orthogroups) with OrthoFinder.
An alignment and a phylogeny is reconstructed for each orthologous group.
The closest homologs of each protein are identified in RefSeq and SwissProt
Data is then integrated into a custom SQL database derived from the bioSQL relational model.

Fig. 1 Figure 1: Simplified annotation workflow.
The pipelines to setup the reference databases and perform the analysis outlibed in Figure 1 are fully automated using NextFlow (except for the setup of the RefSeq database) and can be run simply with the zdb setup and zdb run commands.
Protein annotation
- Protein sequences were annotated using data from multiple databases and various bioinformatic softwares (Figure 1) as detailed below:
COGannotation is done with rpsblast (with an e-value cutoff of 0.001) using position-specific scoring matrix (PSSM) from the Conserved Domain Database (CDD)- Proteins are assigned to Kegg Orthologs (KO) numbers with KofamScan (default parameters) and KOfam (a database of Hidden Markov Models [HMM] of KEGG Orthologs). KofamScan relies on HMMER to search the HMM database.
The KEGG API is used to retrieve the annotation of
Kegg Orthologsand mapping toKEGG modules,KEGG pathways.
PfamScan.pl is used to scan the set of non-redundant protein sequences against the Pfam database to add protein family annotations.
Antimicrobial resistance genes are prediced using the AMRFinderPlus software
Virulence factors are predicted with a protein BLAST of the non-redundant protein sequences against the Virulence Factor Database.
Homology search (RefSeq and SwissProt)
Identification of Orthogroups
Orthogroups (or orthologous groups) were identified with OrthoFinder. This tools identifies orthogroups based on protein BLAST (parameters: -evalue 0.001) results using the MCL clustering software.
Note
Orthologs are pairs of genes that descended from a single gene in the last common ancestor (LCA) of two species.
Note
An orthogroup is the group of genes descended from a single gene in the last common ancestor (LCA) of a group of species.
As gene duplication and loss occur frequently in bacteria, we rarely have exactly one ortholog in each considered genome.
Orthogroup multiple sequence alignments & phylogenies
Protein sequences of each orthogroup are aligned with MAFFT (default parameters). A phylogeny is then reconstructed for each orthogroup of three or more sequences. The phylogeny is reconstructed with FastTree with default parameters. The node support values are not traditionnal boostrap support values. FastTree uses the Shimodaira-Hasegawa test with 1,000 bootstrap replicates to quickly estimate the reliability of each split in the tree. Values higher than 0.95 can be considered as “strongly supported”.
Phylogeny including top RefSeq hits
A second phylogeny is reconstructed for each orthogroup. This phylogeny includes the proteins of the orthogroup plus the 100 best RefSeq hits not already contained in the orthogroup (see the Homology search paragraph). First all RefSeq hits for all proteins in the orthogroup are gathered and sorted by e-value. then, sequences from genomes contained in the database are filtered out, and finally, the top 100 sequences are kept and added to the sequences of the proteins from the orthogroup. These are then aligned with MAFFT (default parameters) and the phylogeny is reconstructed with FastTree (default parameters).
This phylogeny allows users to check whether PVC proteins form a monophyletic group or if they are for instance hints of horizontal gene transfer(s) with bacteria from other phyla.
Calculation of pairwise protein identity
Pairwise protein sequence identities reported on ChlamDB were calculated based on the multiple sequence alignments of orthologous groups (see Orthogroup multiple sequence alignments & phylogenies). As the identity between two sequences can be calculated in different ways (see this blog post discussing ), we chose to calculate it by excluding gaps and calculating the identity based on aligned positions only:
number of matches / ( number of matches + number of mismatches)
Circular genome plots (Circos)
Circular genome plots are generated dynamically with Circos. These plots are not generated based on the alignment of DNA sequences but based on orthology data (see previous paragraphs). The two outer gray circles show the location of open reading frames (ORFs) encoded on the leading and lagging strand of the reference genome (Figure 2 A and B). The red/blue inner circles show the conservation of each protein encoding ORF in one or multiple other genomes. Identity values were pre-calculated from protein alignments (see previous paragraphs). If the compared genomes encode more than one ortholog, the highest identity is used to color the region.
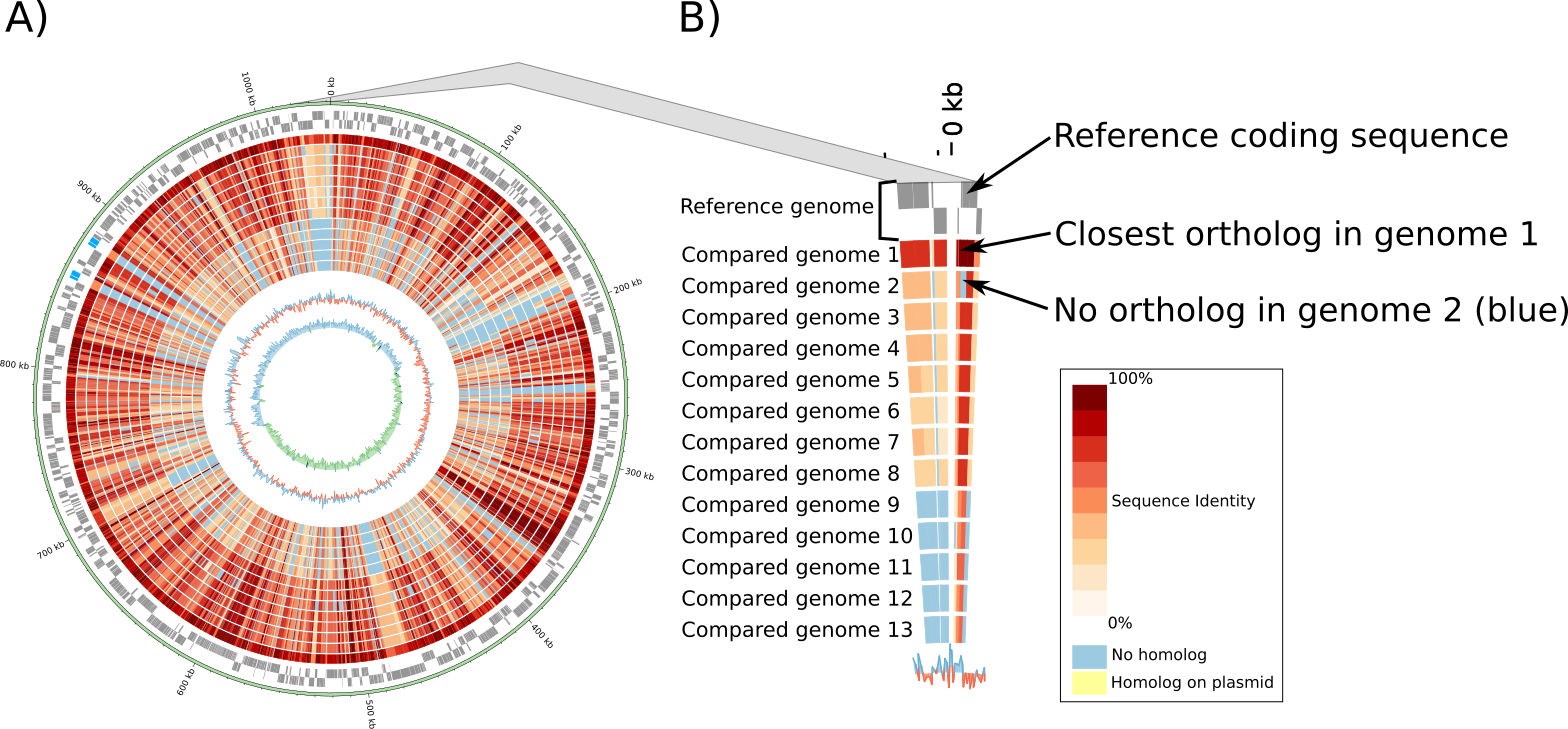
Fig. 2 Figure 2: Example of circular genome plot. A) Compared genomes are ordered based on the median protein identity with the reference genome. B) Zoom showing the detail of a genomic region. All circular plots are interactive and users can click on any ORF to access the detailed annotation page of the corresponding protein.
Species phylogeny
The reference phylogeny is reconstructed with FastTree (default parameters, JTT+CAT model) based on the concatenated alignment of all single copy orthogroups conserved in all genomes.
Evaluation of the quality and completeness of draft genomes
The completeness and contamination of each genome is evaluated with checkM (v1.0.12). Completeness and contamination estimates are reported on the the main phylogeny page.
Database and software versions
Versions of softwares and databases used for a given zDB database are reported on the home page of the webapplication.